Debugging an externally launched WildFly
Contents
- Introduction
- Prerequisites
- Remote debugging
Introduction
WildFly application server is the second most popular Java EE container, so there's a chance that you used it already or you will use it in the near future. One great problem during a delpoyment is when things go wrong in the production environment and you must find out what is wrong with your application. The first thing that comes to your mind is to look through the log files, but what happens when that isn't enough? In the following, i will show you how to run WildFly in debug-mode and how to remote debugging it using Eclipse IDE.
Prerequisites
IDE: Eclipse IDE for Java EE Developers
Java EE container: WildFly 10.x
OS: Windows
Remote debugging
To run WildFly in debug-mode you have to use the following command line:
${WildFlyInstallationPath}\bin\standalone.bat --debug 1044
meaning that it will allow remote debugging on the port specified (you can use any available port). If there is a windows system variable named "JAVA_OPTS" and it contains something like:
-agentlib:jdwp=transport=dt_socket,address=1055,server=y,suspend=n
the above debug configuration will be overwritten by this one.
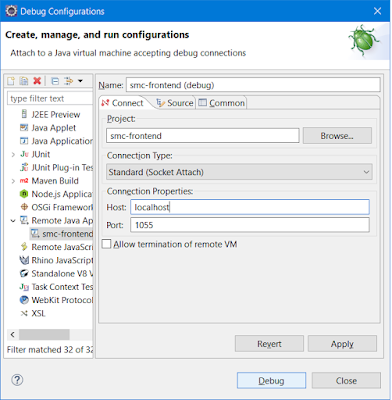
To remote debugging it using Eclipse IDE you have to open Eclipse, open source code of the targeted application and create a debug configuration ("Remote Java Application"):
by specifying the targeted host and port. After this, hit "Debug" button and proceed with the remote debugging.
Enjoy (ง'̀-'́)ง

Comments
Post a Comment